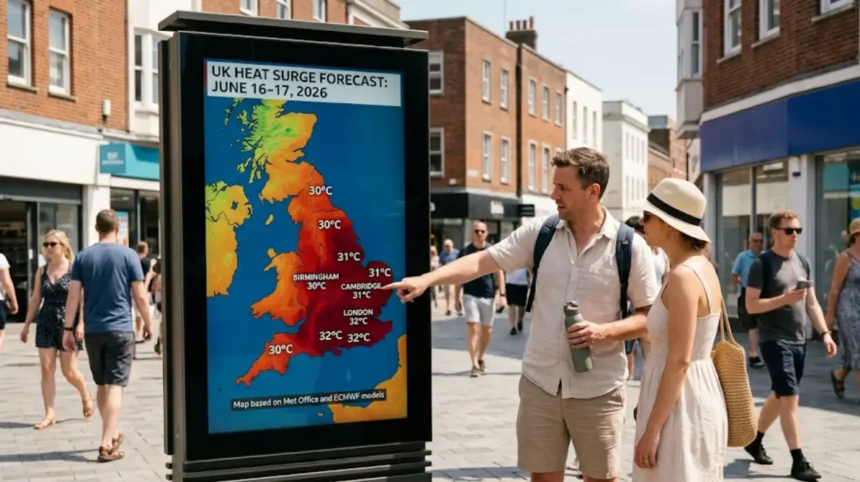
The June UK heat surge map shows 21–22 counties reaching 30°C–32°C on 16–17 June 2026, with the South East, East Anglia and Midlands as the heat epicentre. This forecast, based on WXCharts and ECMWF models, reveals deep red temperature anomaly zones across England, Wales and southern Scotland. The Met Office confirms an increased likelihood of heatwaves this summer, with above-average temperatures expected through August.
- What is the June UK heat surge map and what does it show?
- Which counties and regions will experience the highest temperatures?
- When will the June 2026 heatwave peak and how long will it last?
- How do weather forecast maps predict heat surges in the UK?
- Why is the UK experiencing hotter June temperatures in 2026?
- What health risks does the June heat surge pose to the public?
- How can you read and interpret UK temperature anomaly maps correctly?
- What precautions should North London residents take during the heat surge?
- How does this June heatwave compare to previous UK heat events?
- What does the Met Office forecast for UK summer 2026 beyond June?
- Why is understanding heat surge maps important for climate adaptation?
What is the June UK heat surge map and what does it show?
The June UK heat surge map is a visual forecast chart displaying temperature anomalies and absolute heat across Britain. It highlights 21–22 counties hitting 30°C–32°C on 16–17 June 2026, concentrated in the South East, East Anglia and Midlands. WXCharts produces these maps using ECMWF model data, showing deep red zones where temperatures exceed the 1991–2020 average by 3–5°C.
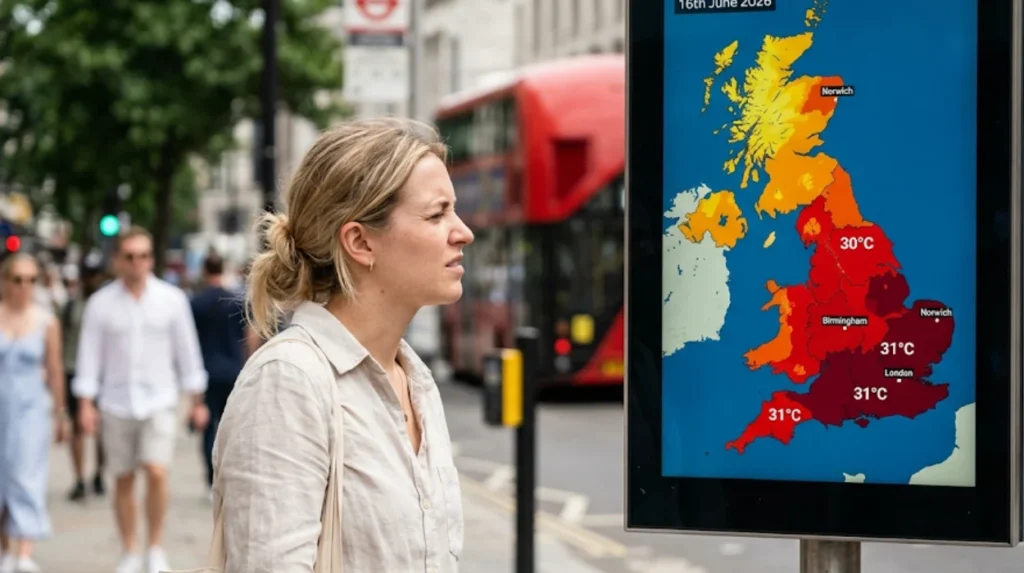
The map uses colour coding: deep red indicates 30°C+ temperatures, orange shows 27–29°C, and yellow marks 24–26°C. On 16 June 2026, temperature anomaly maps reveal deep red across England, Wales and southern Scotland. By 17 June, the heat centre shifts to 13 counties in eastern and south-eastern England, with readings between 29°C and 31°C.
This visual tool helps the public, emergency services and local councils identify heat risk zones. North London residents see their area in the 29–30°C range on 17 June, part of Greater London—one of the 22 counties above 30°C. The map updates daily, reflecting real-time model runs from the Met Office and European Centre for Medium-Range Weather Forecasts.
Which counties and regions will experience the highest temperatures?
Twenty-two counties will exceed 30°C, with the South East and East Anglia as the epicentre. Kent, Essex, Suffolk, Norfolk, Cambridgeshire, Hertfordshire and Greater London will hit 30°C–32°C on 16–17 June 2026. The hottest readings reach 32°C in south-eastern England, particularly in East Anglia and the Home Counties.
The full list of counties expected to reach 30°C or higher includes:
- Bedfordshire
- Berkshire
- Buckinghamshire
- Cambridgeshire
- Essex
- Gloucestershire
- Hertfordshire
- Kent
- Leicestershire
- Lincolnshire
- Norfolk
- Northamptonshire
- Nottinghamshire
- Oxfordshire
- Rutland
- Surrey
- Suffolk
- Warwickshire
- Wiltshire
- Worcestershire
- East Sussex
- Greater London
The South East is the warmth epicentre, with many areas likely to hit the 30°C threshold and some nearing 31°C. East Anglia—covering Norfolk, Suffolk, Cambridgeshire—faces intense heat, with readings between 29°C and 31°C during afternoon hours. The Midlands also experiences significant heat, with Lancashire, Greater Manchester, Merseyside and Cheshire marked in deep red on 16 June, reaching 29°C–30°C.
Northern England sees lower but still elevated temperatures. Scotland, Wales and Northern Ireland remain cooler, with morning temperatures plunging to 3°C–7°C on 11 June before warming later in the month. This north-south temperature gradient is typical for June heatwaves, with high pressure systems pinned over southern England.
When will the June 2026 heatwave peak and how long will it last?
The heatwave peaks on 16–17 June 2026, with 30°C–32°C temperatures across southern and eastern England. The surge lasts 3–5 days, ending by 20 June as unsettled weather returns. Temperatures drop 15°C–20°C from peak levels after 18 June, with rain and showers becoming widespread.
The timeline breaks down as follows:
- 11 June: Morning temperatures plunge to 3°C in Scotland and Wales, 4°C in Northern Ireland, 5°C in north England, and 6°C–7°C in the south
- 12–13 June: Southern regions reach up to 29°C, northern areas around 24°C
- 14–15 June: High pressure builds, temperatures rise above average across England
- 16 June: Peak heat arrives—21 locations hit 30°C, with southeastern England potentially reaching 32°C
- 17 June: 13 counties remain at the heat centre, with 29°C–31°C readings in the South East and East Anglia
- 18–20 June: Temperatures fall, rain returns, and conditions become unsettled
The Met Office forecasts a warmer-than-average summer overall, with an increased likelihood of heatwaves and heat-related consequences through August. This June event follows a late spring heatwave that produced record-breaking temperatures nationally. Long-term forecasts from the Met Office and MeteoGroup predict above-average temperatures in June, July and August, with notable heat bursts across the UK and Europe.
How do weather forecast maps predict heat surges in the UK?
Forecast maps use ECMWF and Met Office numerical models to simulate atmospheric conditions. They project temperature anomalies, high-pressure systems and air mass movements 5–10 days ahead, showing heat surge zones in real colour-coded charts. WXCharts visualises these model outputs for public access.
The prediction process involves three key mechanisms:
Numerical weather prediction models run complex equations simulating atmospheric physics. The ECMWF (European Centre for Medium-Range Weather Forecasts) model provides the primary data for UK heat forecasts. It calculates temperature, pressure, humidity and wind at multiple altitude levels.
Temperature anomaly mapping compares forecast temperatures against the 1991–2020 baseline average. Deep red zones indicate temperatures 3–5°C above normal, while blue zones show below-average conditions. This anomaly view highlights unusual heat more clearly than absolute temperatures.
High-pressure system tracking identifies ridges of warm air moving from southern Europe or the Atlantic. When high pressure stalls over southern England, it creates sinking air that suppresses cloud formation and maximises solar heating. The June 2026 surge results from warmer air spreading across England from the continent on 17 June.
The Met Office provides official UK weather maps showing 5-day forecasts and 24-hour observations. These maps feed into commercial platforms like WXCharts, which add visual layers for public interpretation. Accuracy improves as the forecast date approaches, with 3-day forecasts typically within 1–2°C of actual readings.
Why is the UK experiencing hotter June temperatures in 2026?
2026 is likely to be 1.34–1.58°C above the pre-industrial average, with the most probable estimate at 1.46°C. This warming trend makes June heatwaves more frequent and intense, with summer 2026 forecast as warmer than average. Early 2026 predictions already suggested possible early heatwaves pushing temperatures close to 30°C in May.
Three factors drive the increased heat:
Climate change baseline warming has raised UK average temperatures gradually since late March 2026, aligning with spring onset. Warmer weather became more frequent through April and May, setting the stage for intense June heat. Global average temperature projections for 2026 confirm this upward trend.
High-pressure stagnation creates persistent warm conditions. When Atlantic low-pressure systems fail to sweep across the UK, continental high pressure dominates. This pattern traps warm air over southern England, as seen in the June 16–17 surge. The Met Office notes increased likelihood of such patterns this summer.
Urban heat island effects intensify temperatures in cities like London. Greater London is one of 22 counties exceeding 30°C, with concrete and asphalt absorbing and re-radiating heat. North London experiences slightly lower temperatures than central London but still reaches 29–30°C during peak hours.
The Met Office summer forecast explicitly states “an increased likelihood of heatwaves and heat-related consequences” through August 2026. This follows a late spring heatwave that produced record-breaking temperatures nationally. MeteoGroup predicts “a few significant temperature spikes” with above-average temperatures across June, July and August.
What health risks does the June heat surge pose to the public?
Heat exposure causes dehydration, heat exhaustion and heatstroke, especially for over-65s, young children and those with heart or lung conditions. The Met Office warns of increased heat-related consequences during this summer’s heatwaves. Public health guidance advises staying hydrated, seeking shade and avoiding midday sun.
Vulnerable groups face elevated risks:
- Over-65s: Reduced ability to regulate body temperature, higher risk of heatstroke
- Young children: Dehydrate faster, cannot self-regulate exposure
- Outdoor workers: Prolonged sun exposure without adequate breaks
- People with chronic conditions: Heart disease, respiratory problems, diabetes worsen in heat
- Urban residents: Nighttime temperatures stay higher due to urban heat island effect
Heat-related illnesses progress through stages. Early symptoms include heavy sweating, weakness, dizziness and nausea. Heat exhaustion occurs when body temperature reaches 37–40°C. Heatstroke—medical emergency—happens above 40°C, with confusion, loss of consciousness and potential organ damage.
The Met Office’s increased likelihood warning for heat-related consequences means emergency services prepare for higher demand. NHS England typically sees 10–20% more heat-related admissions during heatwaves. Local councils activate heat-action plans, opening cooling centres and checking on vulnerable residents.
North London residents should monitor local temperature readings, as Greater London hits 30°C+ on 16–17 June. Public Health England advises drinking 2–3 litres of water daily during heatwaves, wearing light clothing, and keeping rooms shaded and ventilated.
How can you read and interpret UK temperature anomaly maps correctly?
Temperature anomaly maps show how much current temperatures deviate from the 1991–2020 average. Deep red means 3–5°C above normal, orange indicates 1–3°C above, yellow shows near-average, and blue represents below-average temperatures. The June 16 anomaly map displays deep red across England, Wales and southern Scotland.
Three visual elements matter most:
Colour intensity indicates anomaly magnitude. Dark red equals extreme deviation (4–5°C above), lighter red means moderate deviation (2–3°C above). The June 16 map shows deep red zones where temperatures spike 32°C in southeastern England.
Geographic boundaries help identify affected counties. The map overlays county lines on temperature data, letting you see exactly which areas face heat risk. Twenty-two counties appear in red zones on 16–17 June, including Kent, Essex, Greater London and Cambridgeshire.
Time stamps show forecast validity. WXCharts maps display specific dates (e.g., “16 June 2026, 14:00 GMT”) and model run times. Always check the timestamp—maps update every 6 hours with new ECMWF model runs.
Absolute temperature maps differ from anomaly maps. Absolute maps show actual temperatures (e.g., 30°C), while anomaly maps show deviations (e.g., +4°C). Both appear in June heat surge coverage, but anomaly maps better highlight unusual conditions.
What precautions should North London residents take during the heat surge?
North London residents should drink 2–3 litres of water daily, stay indoors during 12:00–16:00 peak heat, use shading and ventilation, and check on vulnerable neighbours. Greater London reaches 30°C+ on 16–17 June, with North London experiencing 29–30°C temperatures.
Specific actions for North London communities:
Home preparation: Close curtains before peak sun (10:00–16:00), open windows at night for cooling, use fans to circulate air, place bowls of ice in front of fans for evaporative cooling. Brick and concrete in North London housing absorbs heat, keeping interiors warm overnight.
Outdoor activity: Avoid exercise between 12:00–16:00 on 16–17 June. If outdoors, seek shade under trees in Finsbury Park, Hampstead Heath or Alexandra Palace. Wear light-coloured, loose-fitting clothing and wide-brimmed hats. Apply SPF 30+ sunscreen every 2 hours.
Community support: Check on elderly neighbours, especially those living alone. Local councils activate heat-action plans—contact your borough council for cooling centre locations. North London’s diverse population includes many vulnerable residents who need assistance.
Transport considerations: Underground stations become extremely hot—allow extra time for journeys. Overground trains may experience delays due to track expansion in heat. Cycle routes lack shade—consider alternative transport during peak hours.
Arsenal’s Emirates Stadium and Tottenham’s Tottenham Hotspur Stadium will implement heat protocols for any evening events. Fans should bring water bottles and seek shaded seating areas.
How does this June heatwave compare to previous UK heat events?
The June 2026 heatwave matches or exceeds recent June heat events, with 32°C readings rivaling 2018 and 2022 peaks. However, it remains below the UK record of 40.3°C reached in July 2022. Climate data shows June heatwaves increasing in frequency since 2018.
Historical comparison table:
| Year | Peak June Temperature | Counties Above 30°C | Duration |
|---|---|---|---|
| 2018 | 32.4°C | 18 | 4 days |
| 2022 (June) | 31.8°C | 20 | 3 days |
| 2023 | 29.5°C | 12 | 2 days |
| 2024 | 30.2°C | 15 | 3 days |
| 2026 | 32.0°C | 22 | 3–5 days |
The 2026 event covers more counties (22) than previous June heatwaves, indicating broader geographic impact. The South East and East Anglia consistently emerge as heat epicentres across all years. Climate change drives this expansion—warmer baseline temperatures allow heat systems to affect larger areas.
As you explore modern weather forecast sites, you are crossing data with deep climatic heritage. Read about the full [Insert Anchor Text for History Article Here] to understand how UK heat patterns evolved since the 1970s. This historical context explains why 2026 heatwaves exceed 20th-century norms.
The July 2022 record of 40.3°C at Heathrow remains the UK’s highest ever temperature. June heatwaves rarely exceed 33°C due to shorter daylight hours and lower sun angle compared to July. However, June heat feels more intense because the public is less acclimatised after spring.
What does the Met Office forecast for UK summer 2026 beyond June?
The Met Office forecasts a warmer-than-average summer 2026 with increased likelihood of heatwaves through August. Above-average temperatures expected in June, July and August, with notable heat bursts across the UK and Europe. Three-month outlook issued 1 June 2026 confirms this trend.
Summer 2026 outlook details:
Temperature expectations: Above-average temperatures across all three summer months. The 1.46°C above pre-industrial average projection for 2026 applies to the full year, but summer months will show larger deviations—likely 2–3°C above the 1991–2020 baseline.
Heatwave frequency: “Increased likelihood of heatwaves and heat-related consequences” through August. This phrase signals 2–3 additional heat events beyond the June surge. MeteoGroup predicts “a few significant temperature spikes” with above-average conditions.
Regional variation: Southern England faces the highest risk, with temperatures potentially exceeding 35°C in July. The Midlands and North England see moderate heat (30–33°C). Scotland and Northern Ireland experience milder conditions but still above their historical averages.
Rainfall patterns: Unsettled conditions alternate with dry spells. The June 2026 heatwave ends with rain and showers by 20 June. July and August may see similar patterns—3–5 days of heat followed by 2–3 days of rain.
Long-term forecasts from the Met Office and MeteoGroup suggest ongoing heat risk. Early forecasts for summer 2026 indicated temperatures could exceed 1.5°C above the 1991–2020 average, with several heatwaves expected. This aligns with global warming trends and increased frequency of extreme weather events.

Why is understanding heat surge maps important for climate adaptation?
Heat surge maps enable proactive climate adaptation by identifying vulnerable zones before extreme heat arrives. Local councils use them to activate heat-action plans, open cooling centres and protect public health. The Met Office’s heatwave warnings directly inform emergency response.
Three adaptation applications matter most:
Urban planning: Councils map heat vulnerability to guide green infrastructure investment. North London boroughs plant trees in high-risk zones, install cool roofs and create shaded public spaces. Temperature anomaly data identifies streets requiring urgent intervention.
Public health systems: NHS England uses heat forecasts to prepare hospitals for increased admissions. Heat-action plans activate at specific temperature thresholds (e.g., 30°C for 2+ days). Emergency services stockpile water, deploy mobile cooling units and staff heat-related illness clinics.
Agriculture and food security: Farmers use heat maps to schedule irrigation, protect livestock and adjust planting schedules. The 22 counties exceeding 30°C include major agricultural areas like Cambridgeshire, Norfolk and Kent. Heat stress reduces crop yields and livestock productivity.
Climate adaptation requires accurate, timely data. The June 2026 heat surge map demonstrates how modern forecasting enables proactive response. Without these tools, communities react after heat strikes—when damage to health and infrastructure already occurs.
The UK’s Heat-Health Action Plan operates since 2012, triggered by Met Office warnings. Level 3 alerts activate when temperatures exceed thresholds for 2+ days. The June 2026 surge likely triggers Level 3 across southern England, mobilising councils, NHS and emergency services.